Bringing data together
Figures from your systems flow together automatically — no export, no interim spreadsheet.
Figures from your systems come together automatically, get checked and are published as an overview — with a short written read-out. Anomalies raise their hand on their own.
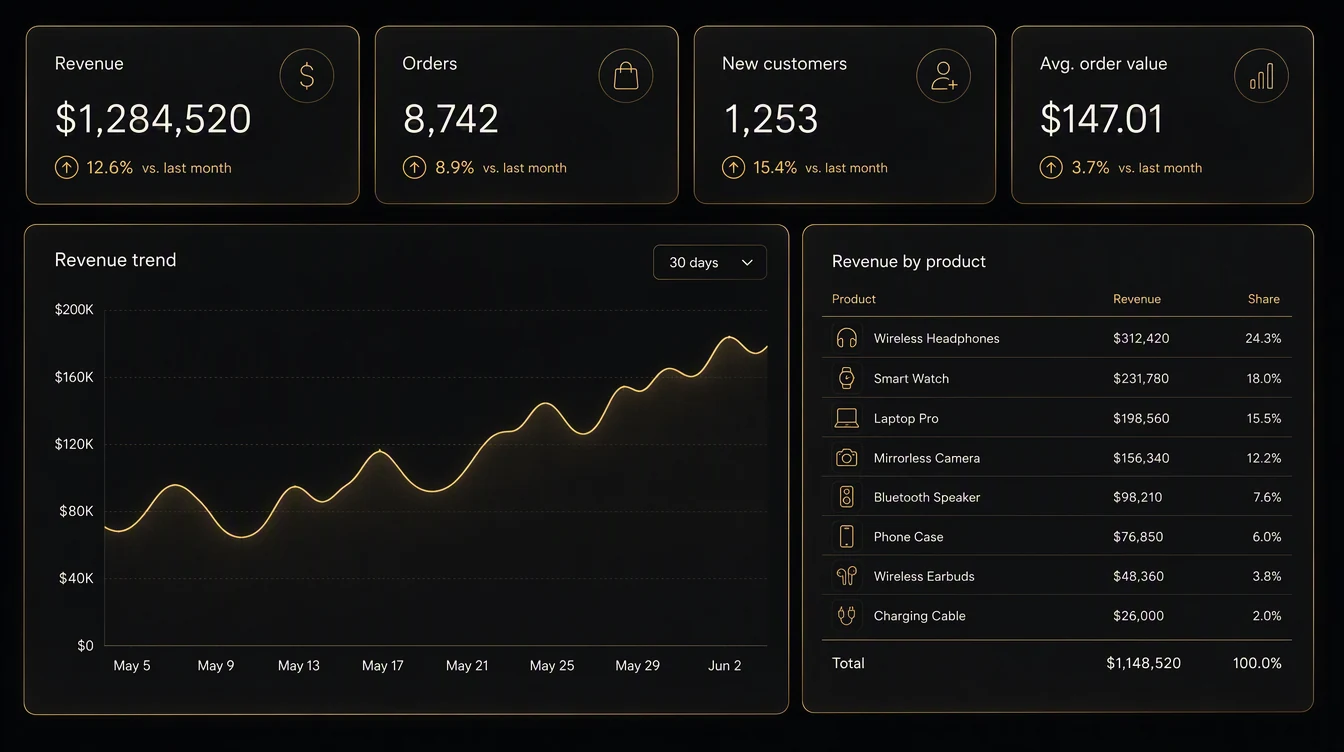
In many companies the monthly report is a fixed appointment — not as a decision, but as labour: export, paste together, format, distribute. By the time it is finished the numbers are a week old.
Automated reporting reverses the order. Data flows together continuously, is checked against your plausibility rules and is ready before anybody asks. Alongside it comes a short read-out in words: what has changed, and what about it is notable.
The real gain is not the hour saved. It is seeing a deviation while there is still time to do something about it.
Figures from your systems flow together automatically — no export, no interim spreadsheet.
Missing or inconsistent values surface before they end up in a decision.
Every overview comes with a short text: what changed and what it means.
If a metric breaks out of range, the report speaks up instead of waiting for month end.
Every month somebody exports data, pastes it together and formats a spreadsheet. It is finished when the numbers are old.
The analysis is ready before anyone asks for it — it explains itself in two sentences and flags outliers immediately.
We look at what actually happens — tasks, frequencies, waiting times, handovers.
Cost today, cost afterwards. That sets the order — biggest lever first.
We build, connect your systems and test against real data. It goes live once it holds.
We measure, sharpen and take on the next workflow.
Both begin with mapping your workflows and producing a prioritised roadmap. Then you decide who builds.
We show you the way — your team walks it.
Outcome: you can start without us.
More on consultingWe show you the way — and walk it with you.
Outcome: it runs — accounts and data stay yours.
Request a process checkQuestions on Reporting & analysis
Usually not. For the common cases a clean path from your systems into the report is enough. A larger foundation only pays off with many sources and high data volume — and we will say so.
Every metric gets a documented definition and a plausibility check. During build we reconcile against your existing report until the two agree.
Yes. Definitions live in one place and can be extended — new metrics are added without rebuilding the report.
Whoever should: management, a department, individual owners. You set the scope and frequency, up to views where each person only sees their own numbers.
Describe it in two or three sentences. You will get a free, no-obligation assessment: whether and how it can be automated — and roughly what that means.